Helicopter Ben Bernanke ushered in free money for all. Look at the growth in M2 in the era since Bernanke unleashed the Fed’s “extraordinary” powers on America’s economy.
If interest rates were so important, then why is this chart from the St. Louis Federal Reserve so telling?
SOURCES: Board of Governors of the Federal Reserve System, “Measuring the Macroeconomic Impact of Monetary Policy at the Zero Lower Bound” (Wu and Xia, 2016) via the Federal Reserve Bank of Atlanta, and authors’ calculations. NOTES: The effective monetary policy rate is the effective federal funds rate when positive and the Wu-Xia shadow rate when negative. Data are monthly. We report the monthly average of the Goldman Sachs Financial Conditions Index. An index value of 100 indicates average conditions.
Here, the St. Louis Fed explains the effect of Fed policy on consumption, writing:
Consumption and Financial Conditions during the 2021 Tightening Episode
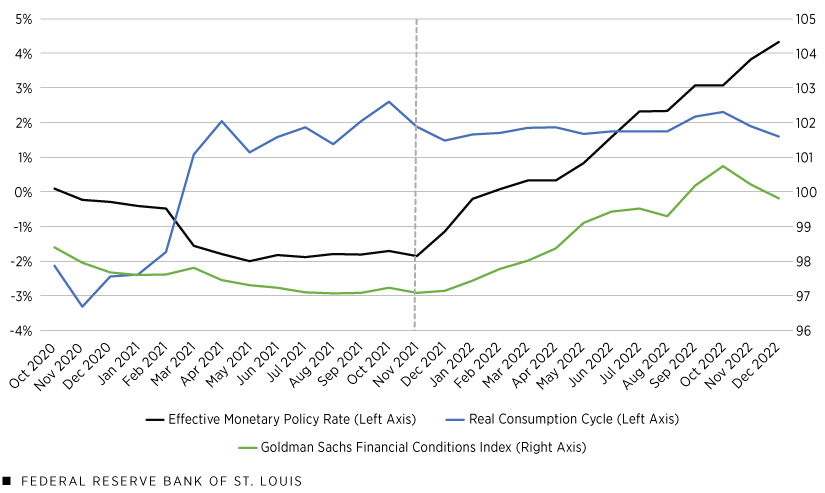
The next figure focuses on the most recent tightening episode, the beginning of which is marked by the vertical dashed line. For simplicity, we included only the effective monetary policy rate as we previously defined it (the black line below) and excluded its effective federal funds rate and shadow rate components.
Monetary Policy Rate, Consumption and Financial Conditions, October 2020-December 2022
SOURCES: Board of Governors of the Federal Reserve System, “Measuring the Macroeconomic Impact of Monetary Policy at the Zero Lower Bound” (Wu and Xia, 2016) via the Federal Reserve Bank of Atlanta, and authors’ calculations. NOTES: The effective monetary policy rate is the effective federal funds rate when positive and the Wu-Xia shadow rate when negative. Data are monthly. We report the monthly average of the Goldman Sachs Financial Conditions Index. An index value of 100 indicates average conditions.
As the figure illustrates, consumption as measured by the real consumption cycle (the blue line) declined slightly following the start of the 2021 tightening episode. Despite small fluctuations such as that, the real consumption cycle has consistently lingered about 2% above trend since the start of the tightening episode. The positive values of the real consumption cycle indicate that consumption was higher than normal. Slower growth in the last two months of 2022 supports the theory that tightening monetary policy decreases consumption, but this evidence is weakened by the fact that consumption remained higher than normal.
The green line represents a financial conditions index constructed by Goldman Sachs. A higher value on the index indicates that it is harder to borrow and invest, for example, because of higher borrowing costs for companies or lower equity prices. The index generally followed the movements in the effective monetary policy rate before and during the 2021 tightening episode; however, in the last two months of 2022, the index declined, meaning that financial conditions eased despite the Fed’s interest rate hikes. Since the beginning of the tightening episode, most months have registered average or better-than-average (an index value below 100) financial conditions, which may help to explain why consumption has remained elevated during this period.
In conclusion, there is some evidence, although weak and not recent, that the real consumption cycle declines during episodes of monetary policy tightening. In 2022, consumption remained approximately 2% above trend. Additionally, financial conditions—shown by the financial conditions index—improved at the end of 2022 despite the Fed tightening monetary policy. Looking toward the future, it may be important to track the correlation of the financial conditions index and the effective monetary policy rate, which have recently diverged, to predict the behavior of consumption and inflation.