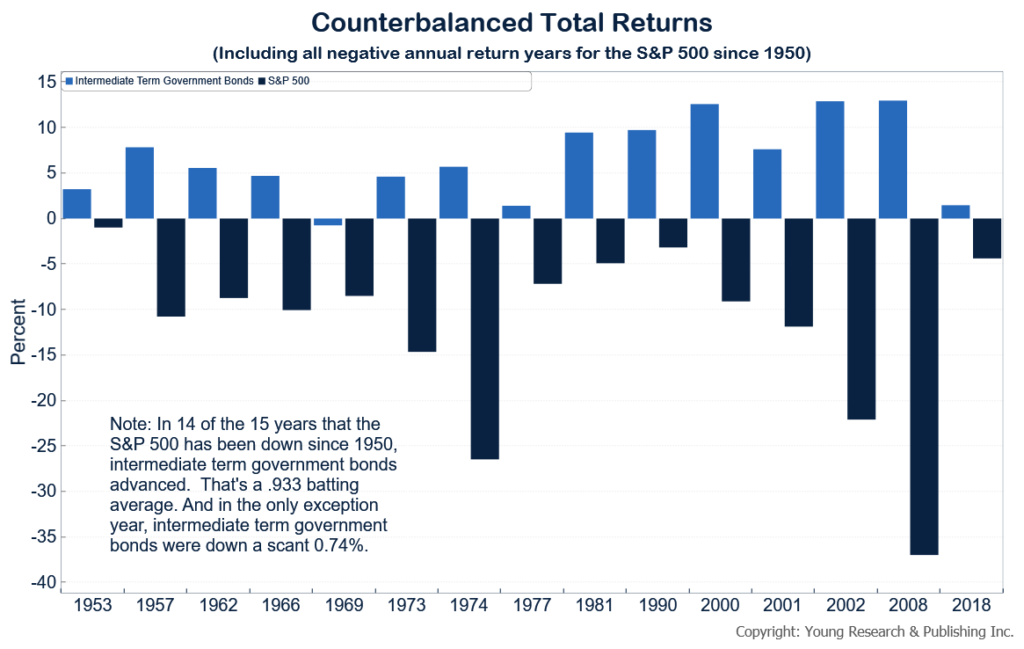
Last year, when stocks lost money, bonds were up. It’s the magic of counterbalancing.
As you can see in the chart below. In 14 of the 15 years that the S&P 500 has been down since 1950, intermediate term government bonds advanced. That’s a .933 batting average. And in the only exception year, in the 60s, the bonds were down a scant 0.74%.
In this record stock market this is a chart you may want to share with your friends and family.
E.J. Smith - Your Survival Guy
Latest posts by E.J. Smith - Your Survival Guy (see all)
- “What Do You Do If the Market Crashes?” - April 19, 2024
- Costco Gold Bars Sell Out Despite Premium Price - April 19, 2024
- A Wise Man’s Take on the Boston Bruins Playoff Chances - April 19, 2024
- Is Your Retirement Life a Mess? Let’s Talk - April 18, 2024
- Your Survival Guy Learns from Marie Kondo - April 18, 2024


