President Donald J. Trump waves Sunday, July 7, 2019, as he prepares to board Air Force One at the Morristown Municipal Airport in Morristown, N.J., for his return to Washington, D.C. (Official White House Photo by Shealah Craighead)
Yesterday, I explained the past performance in equities markets during each year of the presidential election cycle. I also noted that the tradition of strong performance during the year before and of the election have broken down somewhat this century.
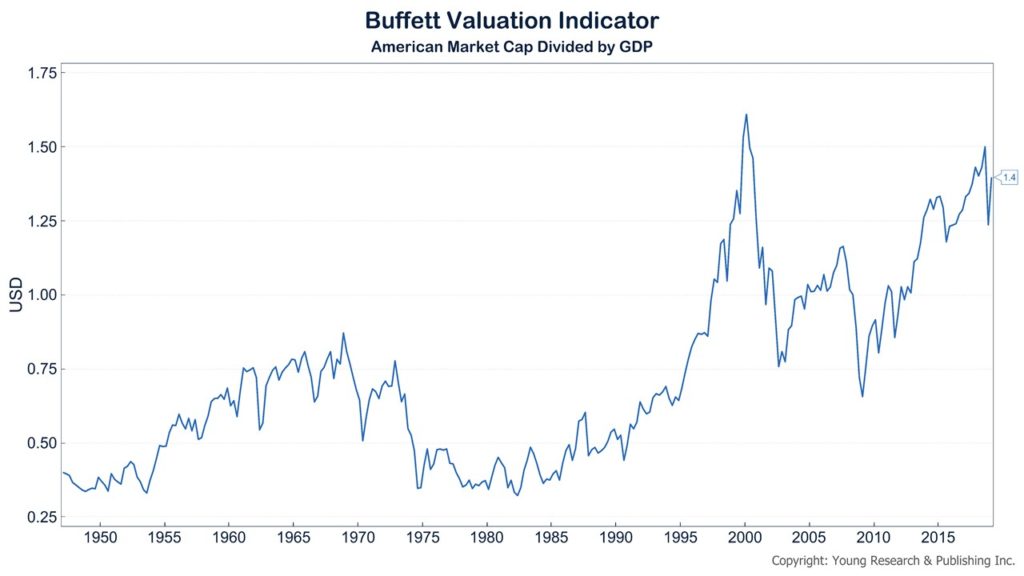
With that in mind, I’d like you to look at the so-called Buffett Valuation Indicator, known as a tool Warren Buffett uses for getting a feel for market under- or over-valuation.
The tool is simple, it’s the market cap of American stock markets divided by the country’s GDP. The higher the ratio, the more likely markets are overvalued, and vice versa. You can see in my chart below that the ratio is currently quite high compared to its historical levels.
It’s hard to imagine, with markets valued so richly, where growth will come from in the stock market during this year and next, despite being traditionally the best of the presidential election cycle. Here’s another look at the history of election cycle returns:
E.J. Smith - Your Survival Guy
Latest posts by E.J. Smith - Your Survival Guy (see all)
- Your Survival Guy Breaks Down Boxes, Do You? - April 25, 2024
- Oracle’s Vision for the Future—Larry Ellison Keynote - April 25, 2024
- Investing Is Math - April 25, 2024
- Breaking: New Rules on Trillions in IRAs and 401(k)s - April 24, 2024
- When You’re in Control, You Have Opportunities - April 24, 2024


